
In the past two weeks, climate change got its due respect on debates, on TV screens, and on the streets around the world thanks to Greta Thunberg, a Swedish environmental activist on climate change whose campaigning has gained international recognition when she spoke at the United Nations General Assembly.
Last week, I attended my first professional development workshop of my Humphrey year in Denver. I was attending #MigraHack2019 at the University of Denver as I was interested in data-driven approach to understand immigration. I wanted to know how to use or hack open data on immigration in order to tell different stories that will help us better understand the conversation surrounding immigration.
Before working on my specific project, I attended sessions like “Myths and Misconceptions Around Immigration.” I got to know many people around the world don’t understand the truth behind the immigration processes and procedures. For example, one of the speakers informed us how a Mexican woman sold everything she owned because she thought migrating to the United States would give her better life standards and opportunities, but she made her life miserable since the day she crossed border.
Later, organizers divided all of the participants into a group of four and five people. Each group had one expert from a different field, like one journalist, one data visualizer, one climate change expert and one student from Denver University.
It was my interest to study Climate Change and its relationship with human migration. We have been provided open data through Github.com, which is a development platform for open source where we can review code, manage projects, and build software alongside developers.
During my two days there, I focused on data exploration, data cleaning and conversion of data visuals. We focused our topic, Global Climate Related Displacements & Migration to the United States, into questions like “what is the flow of immigrants/refugees from the most climate change affected/impacted places in the world to the United States across time?”
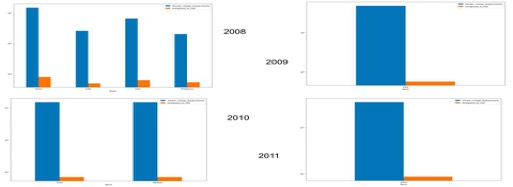
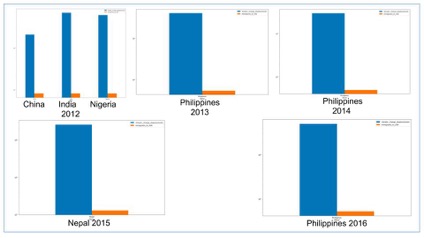
With the given data, we found that seven countries (China, India, Pakistan, Nigeria, Philippines, Nepal, and Cuba) were the most affected countries of weather-related climate change such as floods and storms from 2008 to 2016.
Floods and storms have caused maximum displacement across the world.
From the data, we depicted that total displacements of each country were comparatively higher than people migrating to the US. However, we assume that the impact of climate change leads to the majority of internal displacements compared to overseas displacements.
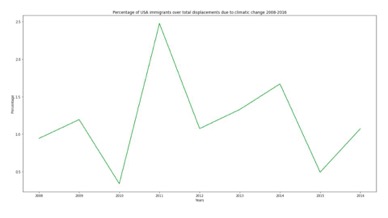
From the line chart above, it can be extrapolated that the maximum percentage of US immigrants from climatic change displacement countries is about 2.5 percent for 2011. Which means that an average immigrant coming into the US represents about 1.177 percent of the total global displacements due to climate changes. The minimum percentage of US immigrants out of total global displacements was about 0.5 percent in 2010. Then, there was a stark increase from 0.5 percent to 2.5 percent of US immigrants in 2010 to 2011. Aditionally, there has been a gradual decrease from 2011-2016 from 2.5 percent to 1.5 percent of US immigrants.
From 2010-2018 China, Mexico, India, Pakistan, Iran, Iraq, Columbia and Cuba contributed the highest number of immigrants to the United States due to weather-related displacements.
While major climate events affect both internal and international migrations, our data shows that internal weather-related displacements are comparatively a lot higher than international displacements or displacements from climate and weather change hotspots to countries like the United States.